

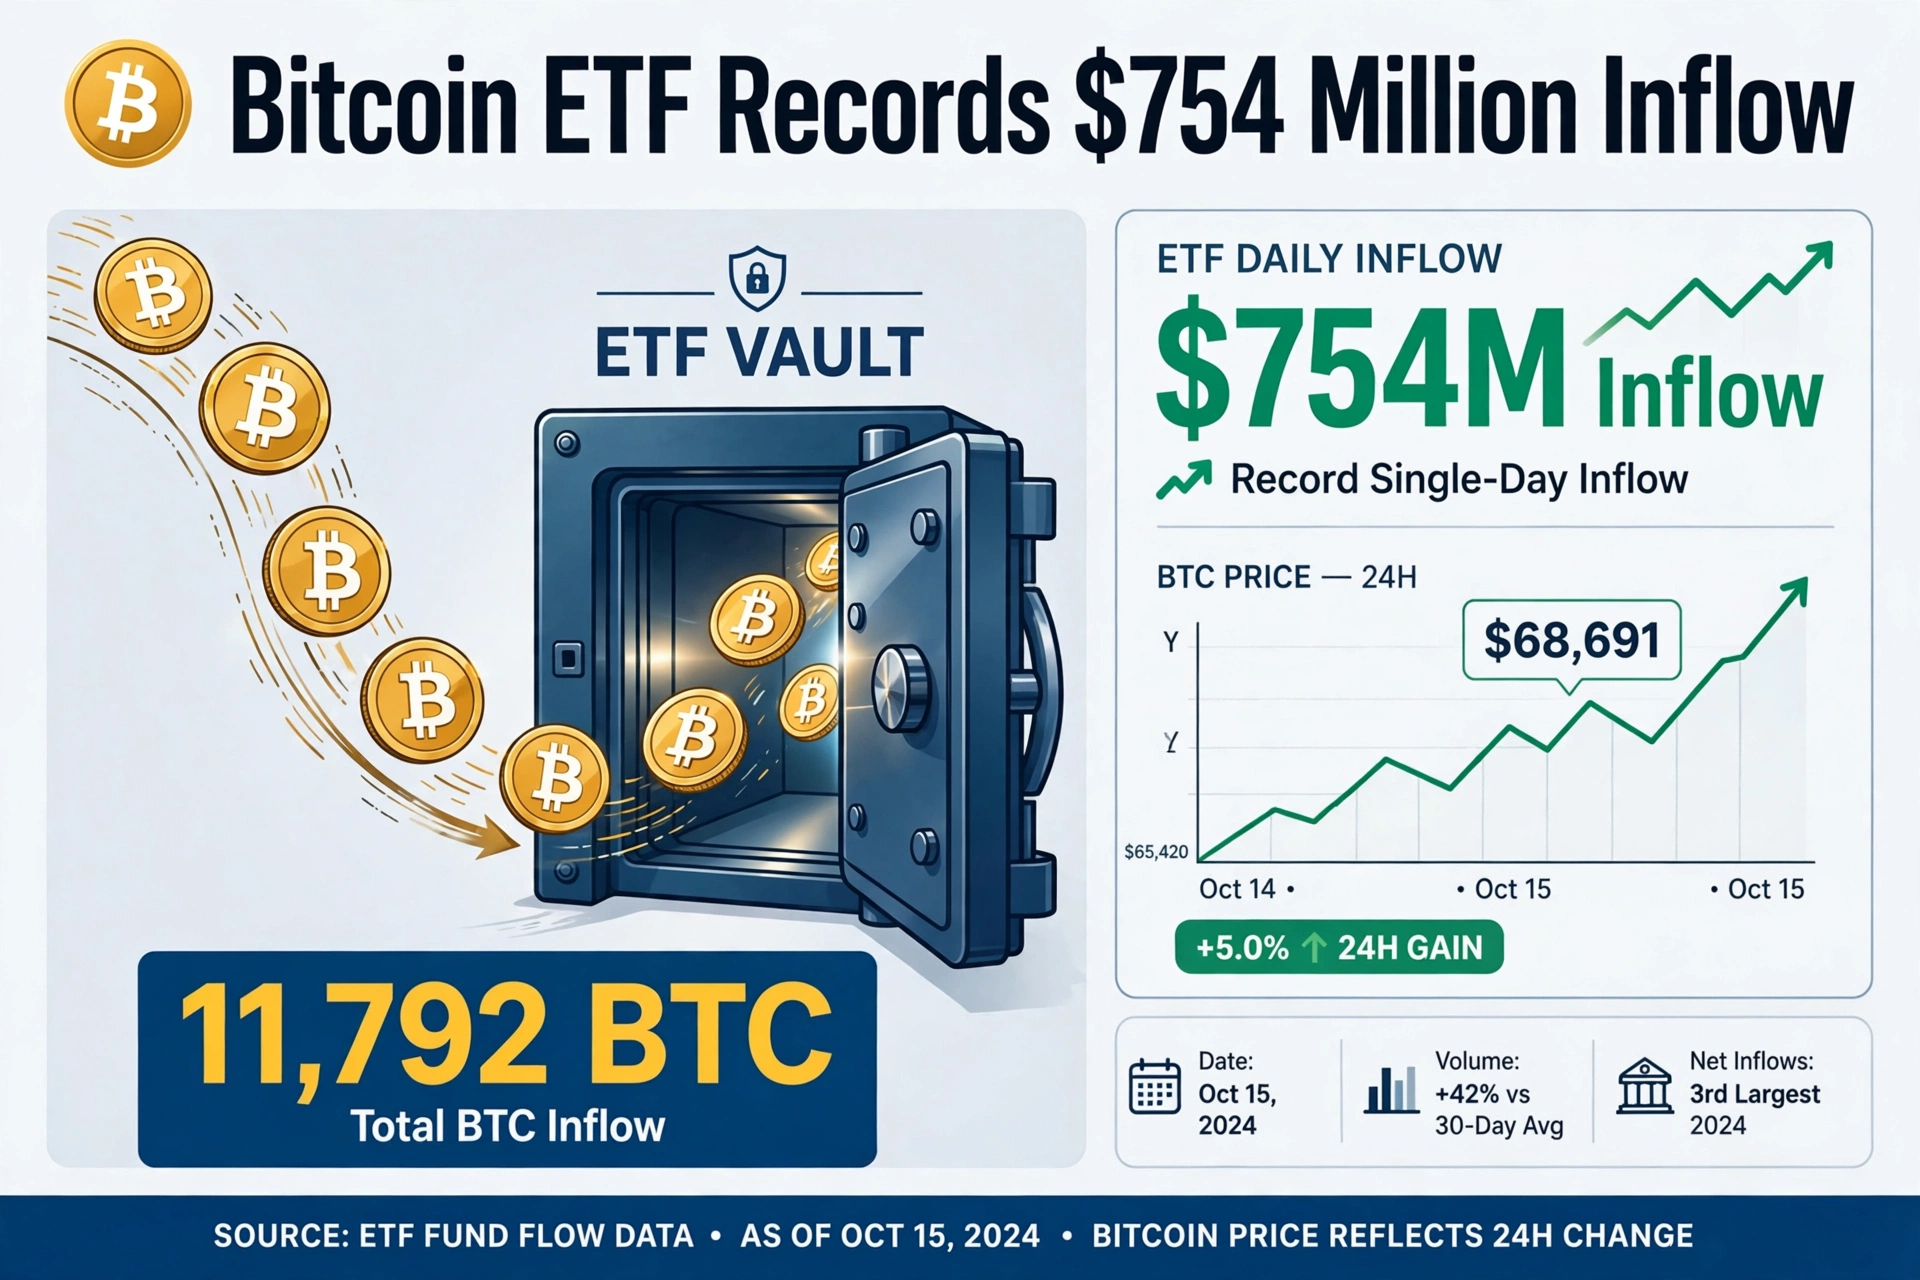

Key Insights At a Glance
- Bitcoin ETF inflows reached $754 million, making it the second-best weekly inflow of the year.
- ETF providers absorbed 11,792 BTC during the week, signaling a major reversal from negative flows since May.
- BTC price climbed approximately 5% on the buying pressure but remains below the short-term holder Realized Price.
- Market analysts are still debating whether Bitcoin has found a bottom near $60,000.
- BTC price remains 3.8% below the short-term holder cost basis of $67,523.
Bitcoin ETF Inflow Hits $754 Million: The Second-Best Week of 2026
Bitcoin ETF buying rose sharply this week, with 11,792 BTC worth about $754 million moving into ETF provider wallets. The figure was the second-best weekly inflow of the year, giving the market a fresh sign of demand while BTC price remained below the short-term holder cost basis.
According to market analyst Darkfost, Bitcoin ETF wallets took in 11,792 BTC during the week, with the coins valued at about $754 million at the prices used in the post. That made the week the second-best for ETF inflows this year.
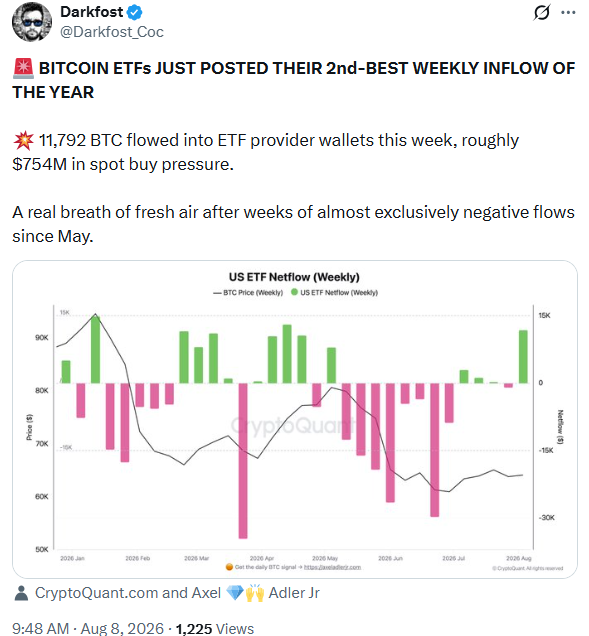
This inflow is significant for three reasons:
1. A Trend Reversal: The latest buying marks a clear change from the recent trend. ETF flows had been mostly negative since May. After months of outflows and weak institutional demand, this week showed that a large amount of Bitcoin was bought through spot ETFs during the week.
2. Institutional Confidence: The inflow comes as traders watch the next move in BTC price. Strong ETF buying can show that investors are still willing to buy Bitcoin, even after a period of weak flows. For retail and institutional investors tracking spot Bitcoin ETFs like BlackRock’s IBIT, Fidelity’s FBTC, and Grayscale’s GBTC, ETF flow data has become a primary sentiment indicator.
3. Market Support Level: The $754 million figure is also important because ETF activity has become a closely watched part of the Bitcoin market. If buying continues, it could give Bitcoin more support. If flows turn negative again, the recent increase in demand may prove short-lived.
For now, the main point is that Bitcoin ETF demand improved at a time when the market had seen weeks of poor flows. However, analysts caution that one strong week does not settle the direction of the market.
Has Bitcoin (BTC) Price Bottomed at $60,000?
While ETF inflows dominate headlines, the broader question remains: Has Bitcoin bottomed?
Market analyst Astronomer continues to point to a $60,000 bottom call made in February amid the regaining momentum of the Bitcoin ETF segment. Back then, the view received heavy criticism. More recently, even reminders of the $60,000 target have faced strong pushback.
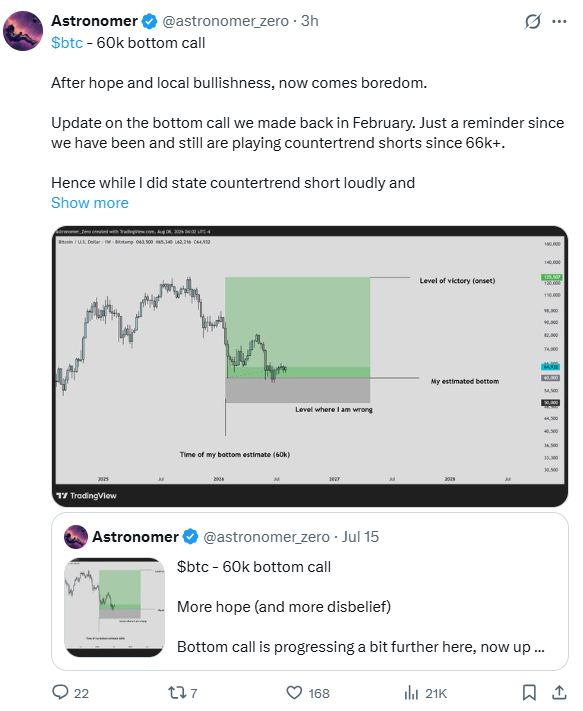
The market psychology around the bottom call is revealing. Some traders who were once calling for a deeper fall are now talking about a July rally, swing trades, and much higher prices. Astronomer does not think the market needs extremely negative sentiment to form a bottom. Instead, the analyst says boredom can be part of the process. This happens when price moves slowly, and traders begin to lose interest.
According to Astronomer, this view fits the current market. Bitcoin has been moving within a range, while sentiment has shifted. The analyst believes this can wear out traders and help set up a bottom.
Still, the $60,000 level remains a market call, not a confirmed bottom. The current ETF buying is encouraging for Bitcoin bulls, but it does not prove that Bitcoin cannot fall again.
From an SEO and investment perspective, the keywords “Bitcoin bottom,” “BTC price bottom,” and “is Bitcoin bottom in” are trending because $60K represents a key psychological and technical support level. A confirmed breakdown below it could open the door to $52K-$55K, while holding it strengthens the case for a Q4 rally.
Bitcoin Short-Term Holder Pressure: A Critical Resistance at $67,523
Despite the 5% price bump and massive ETF inflow, on-chain data shows ongoing pressure.
Axel Adler Jr said BTC price was trading below the short-term holder cost basis on August 8. Bitcoin was trading at $64,952, while the short-term holder Realized Price was $67,523, CoinMarketCap data showed. That put BTC price $2,571, or 3.8%, below the level. Adler said this was the narrowest gap since July 21.
Who are short-term holders? Short-term holders are people holding coins for less than 155 days. Their Realized Price shows the average level at which those coins were acquired. With Bitcoin below that level, newer holders are, on average, sitting below their buying price.
This creates a classic resistance dynamic:
Adler also noted that Bitcoin had closed below the short-term holder Realized Price 279 times in the past 284 days. He expects some short-term holders to sell as they try to get back to their buying price.
In other words, as BTC approaches $67,523, many recent buyers who are currently at a loss may look to exit at break-even, creating selling pressure. This explains why BTC price remains below $67,523 despite strong ETF demand.
That leaves the market with two different signals. Bitcoin ETF flows show strong buying during the week, while short-term holders are facing pressure below their cost basis. The next moves in BTC price will show whether ETF demand can keep up with selling pressure from recent buyers. For now, both sides remain important as Bitcoin trades below $67,523.
What This Means for Bitcoin Investors in 2026
The intersection of record Bitcoin ETF inflows and short-term holder resistance defines the current market structure.
Bullish Case: If ETF inflows sustain above $500M per week, institutional absorption could overwhelm STH selling near $67,500. A daily close above $67,523 would flip short-term holders back into profit, reducing sell pressure and potentially triggering a momentum run toward $72,000-$75,000.
Bearish Case: If the $754 million inflow was a one-off short-covering event and flows revert to negative, Bitcoin could retest the debated $60,000 bottom. The fact that Bitcoin has spent 279 of the last 284 days below the STH Realized Price suggests underlying weakness in new demand.
Neutral Case: Bitcoin continues to chop between $60K and $68K, with boredom and low volatility shaking out leverage. This is the scenario Astronomer describes as necessary for a durable bottom formation.
As always, readers should note that technical projections are speculative in nature and may not accurately reflect future market behavior. This article should not be treated as personalized investment advice and is for informational purposes only. Investors must exercise due diligence or get professional guidance while making their investment plans, as the crypto market often goes through highly volatile trading.
